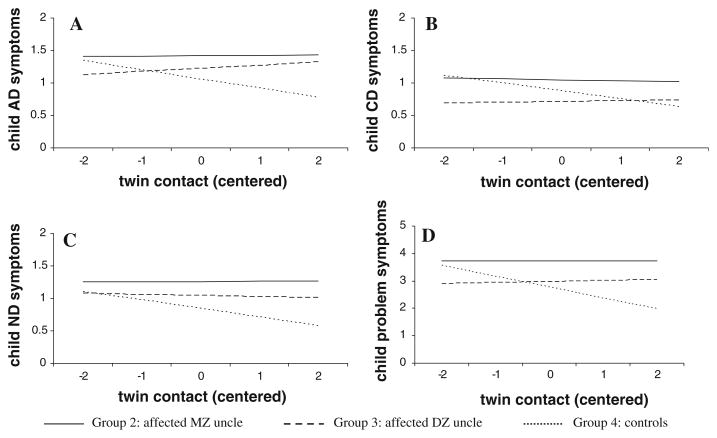
Fig. 1.
Regression lines for each child outcome variable: Panel A, child alcohol dependence symptoms; Panel B, child conduct disorder symptoms; Panel C, child nicotine dependence symptoms; and Panel D, child problem symptoms. Lines are based on average values for the covariates. Note the different scale on the y-axis for problem symptoms. The actual range of twin contact was from −2.8 to 3.2

