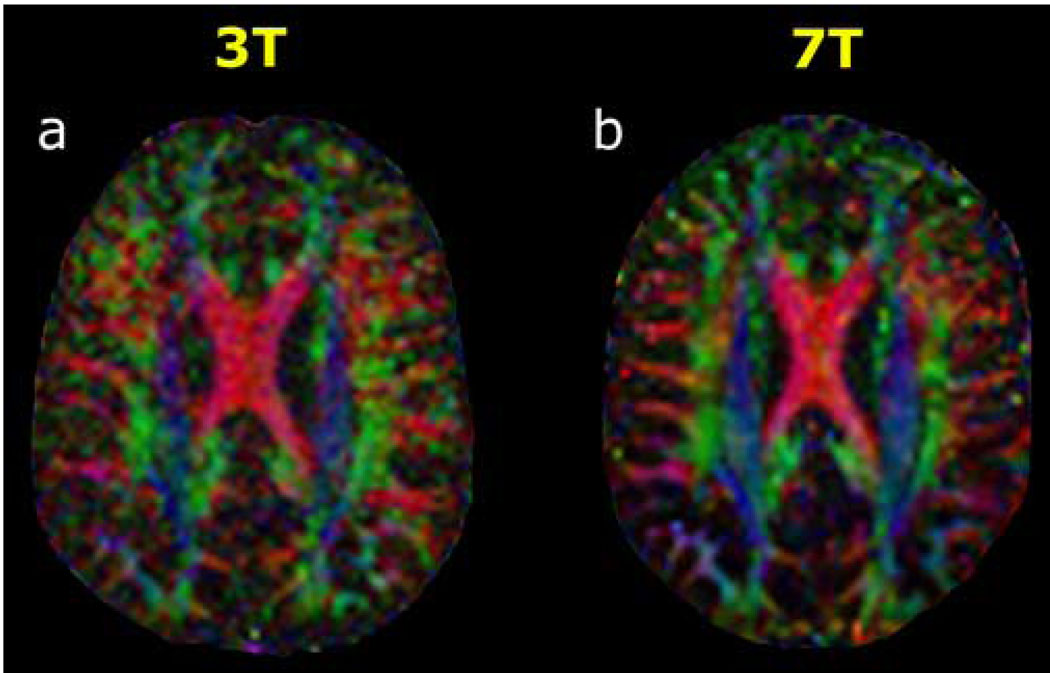
Figure 1. 3T versus 7T diffusion tensor imaging with 36 diffusion-encoding directions at b=3000 s·mm−2.
Directionally-encoded color fractional anisotropy (FA) maps at the axial level of the body of the corpus callosum are shown for (a) 3 Tesla and for (b) 7 Tesla in a 38-year-old normal volunteer. The standard DTI color conventions are used, with red representing left-right fiber orientation, green representing anteroposterior, and blue representing craniocaudal. The superior SNR at 7T compared to 3T is evident from these color FA images.

