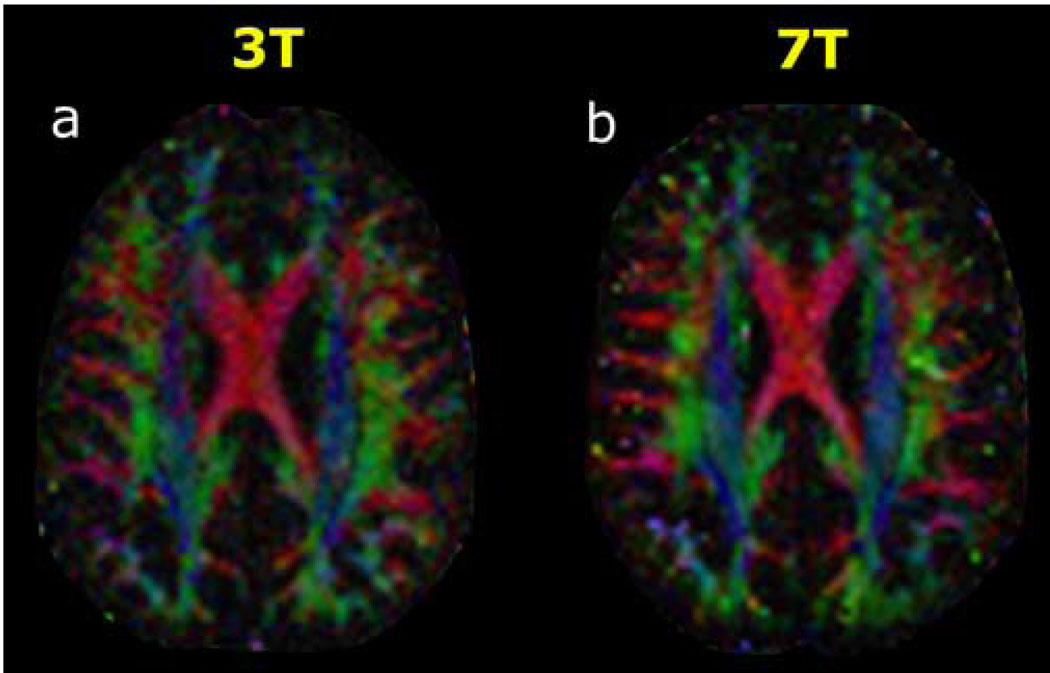
Figure 3. 3T versus 7T DTI with 131 diffusion-encoding directions at b=6000 s·mm−2.
Directionally-encoded color FA maps at the axial level of the body of the corpus callosum are shown for (a) 3 Tesla and for (b) 7 Tesla in a 38-year-old normal volunteer. Conventions are as in Figure 1. The superior SNR at 7T compared to 3T is again evident from these color FA images, although the difference is not as great as at b=3000 s·mm−2 (Figure 1).

