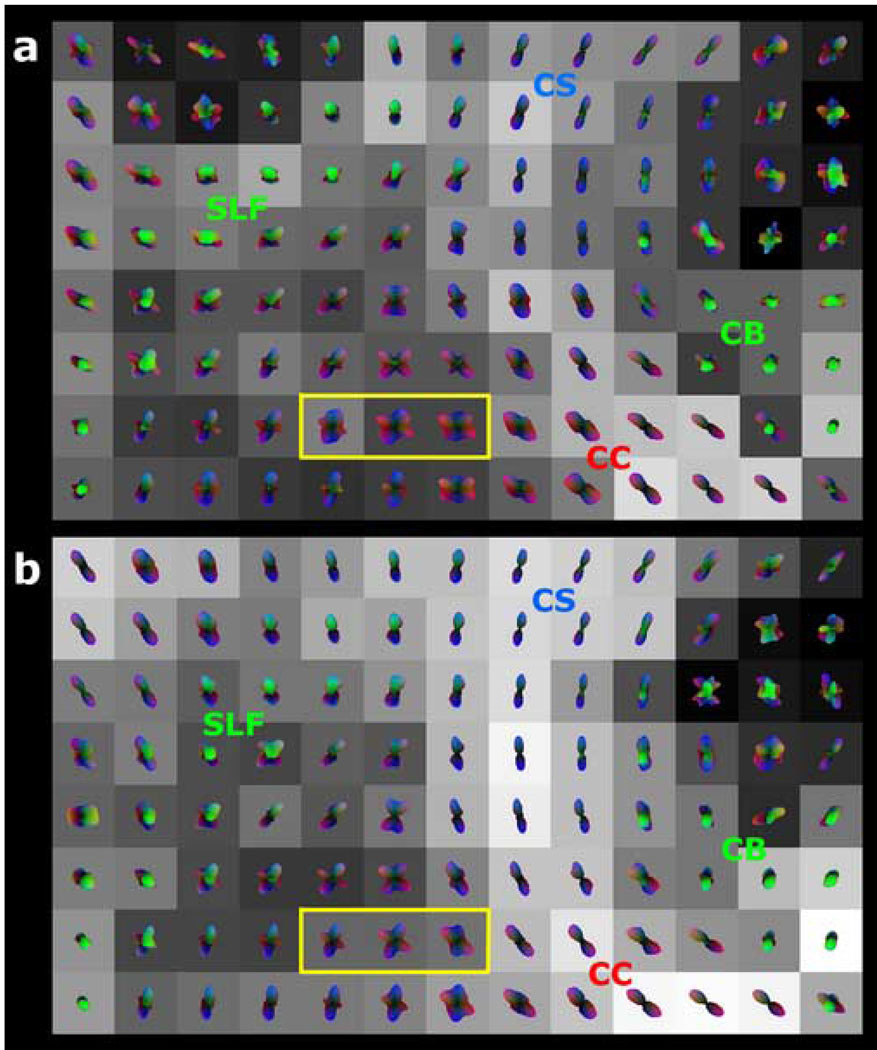
Figure 5. 3T versus 7T q-ball imaging of crossing supratentorial fiber tracts with 131 diffusion-encoding directions at b=6000 s·mm−2, using radial basis function (RBF) reconstruction.
RBF reconstruction of q-ball ODFs was performed for the same HARDI datasets as in Figure 4, using the same conventions for illustration. The 3T results are displayed in (a) and the 7T results are displayed in (b). The interpolation kernel width σi=4° optimized the condition number of the RBF reconstruction matrix. The smoothing kernel width σs=15° was used for best visual results, as recommended by Tuch (Tuch, 2004). The findings are similar to Figure 4, with superior results found at 7T compared to 3T, again best seen in the voxels enclosed in the yellow boxes of (a) and of (b).

