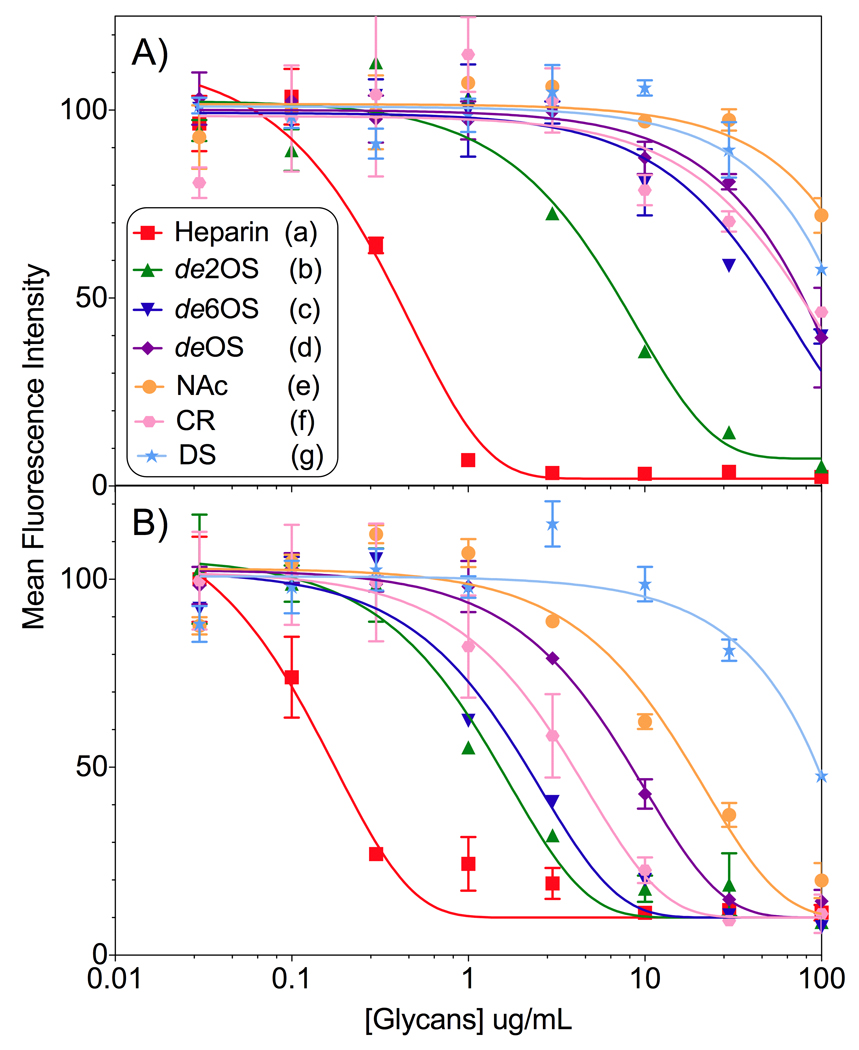
Figure 3.
Normalized inhibition curves for A) monomeric guanidinoneomycin 1 and B) dimeric guanidinoneomycin 2. See Scheme 4 for structures of glycans A–G.[52] Key: heparin (red), de 2-O sulfated heparin (green), de 6-O sulfated heparin (navy), de O sulfated heparin (purple), N-Acetylated heparin (orange), carboxy reduced heparin (pink), and dermatan sulfate (teal).

