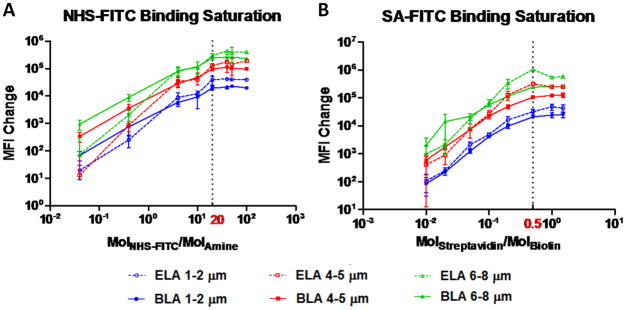
Figure 5.
Optimization of ligand:functionalized lipid ratio. MFI was measured before and after microbubble samples reacted with various amounts of ligands after 12 hrs at room temperature. (A) NHS-FITC:DSPE-PEG2000-A with molar ratio varied between 0.04 and 100. 20 molar ratio (dash line) was used for all subsequent kinetics studies. (B) SA-FITC:DSPE-PEG2000-B with molar ratio varied between 0.01 and 1.5. 0.5 molar ratio (dash line) was used for all subsequent kinetics studies.

