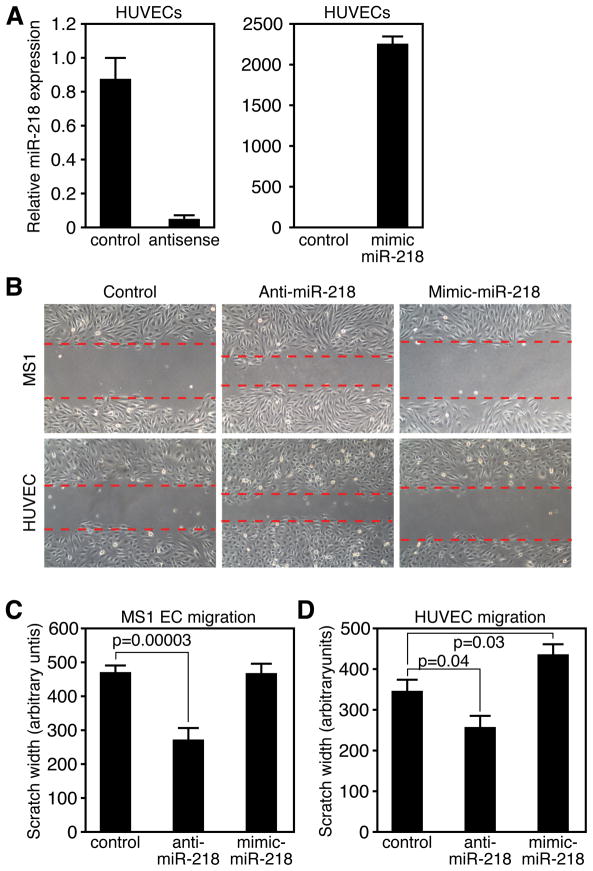
Figure 4. miR-218 contributes to EC migration.
A. Real Time RT-PCR reveals knockdown or overexpression of miR-218 in HUVECs transfected with 2-O’Me modified antisense or mimic oligonucleotides. B. Images of scratch wound following ~12 hours of incubation. MS1 cells (top row) or HUVECs (bottom row) were transfected with control, anti miR-218 or miR-218 mimic for 48 hours prior to scratch assay. Dotted lines denote front of EC migration. C, E. Quantification of migration in MS1 ECs (D) or HUVECs (E). Y-axis is the width of the “wound” 12 hours after scratching. Measurements are taken at 4 locations per well in duplicate wells in 3 independent experiments. Error bars represent SEM.

