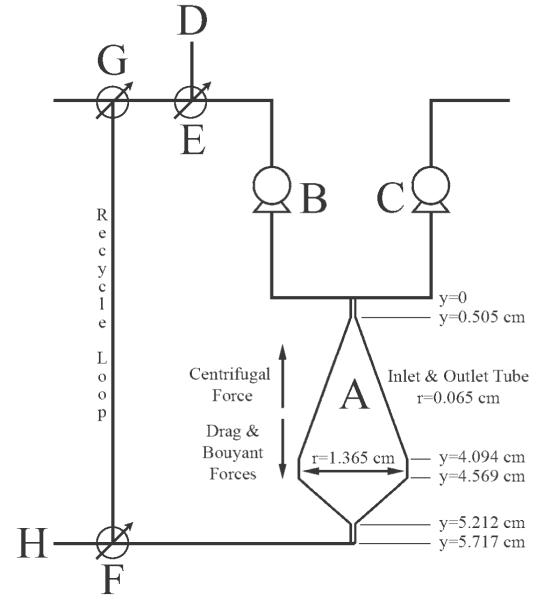
Figure 1. Process flow diagram of the system used to visualize movement of fluid throughout the CCBR (A). Pumps were used to move either undyed PBS (B) or BPB dyed PBS (C) from a reservoir to the reactor. Inoculation line (D) and valve (E) were used to introduce cells into the system, whereas valves (F) and (G) were used to recycle reactor effluent or direct the effluent to waste (H).
During reactor operation, system rotation and fluid movement provided cells with centrifugal force opposed by buoyant and drag forces; when these forces are balanced cells are immobilized in the reactor. Important reactor dimensions needed in numerical simulations are also provided.

