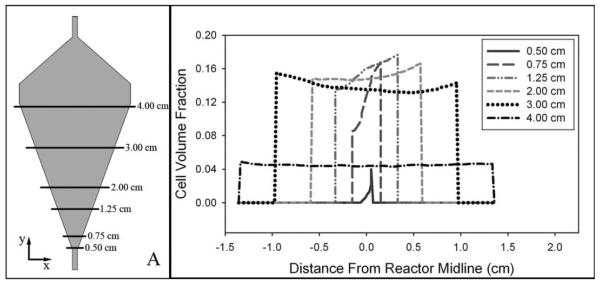
Figure 7. An increasing density of cells across a reactor cross section reaching a maximum at the right reactor wall indicates a region of increased cell concentration.
The gray shaded area in panel (A) corresponds to the x–y plane at z = 0 and the volume fraction along each horizontal line is shown in panel (B). Accumulation of cells along the right-side wall of the reactor suggests a preferential flow along the opposite wall. The left wall of the reactor is the same wall along which the majority of fluid flow is observed during CCBR operation in the absence of cells.

