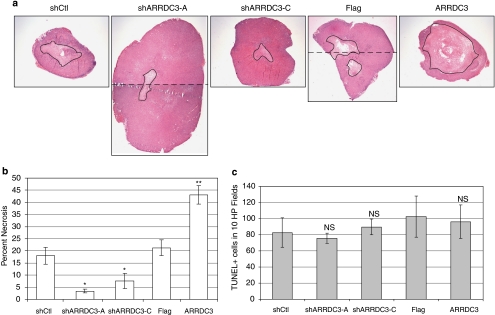
Figure 4.
ARRDC3 repression promotes in vivo cell survival. Tumors were cut in half along the longest axis therefore the center-most section of the tumor was used to make slides. Changes in necrosis are more evident when tumors of comparable size are analyzed. (a, b) Repression of ARRDC3 (shARRDC3) leads to a decrease in xenograft tumor necrosis (outlined in black) compared with control (shCtl), whereas overexpression of ARRDC3 (ARRDC3) leads to an increase in xenograft tumor necrosis compared with vector control (Flag). Dashed line represents the point where two images were merged to visualize the entire tumor section. Five tumors from each line were analyzed and the area of necrosis measured. Data bars represent mean±s.e.m. Single asterisk represents P<0.05, whereas a double asterisk represents P<0.001 as determined by Student's t-test. (c) ARRDC3 does not affect the number of apoptotic cells in xenograft tumors. Terminal deoxynucleotidyl transferase-mediated dUTP-biotin nick end labeling (TUNEL) analysis was performed on tumor sections and the number of positive cells in 10 high-powered fields ( × 40) was counted. Five tumors per group were analyzed and data bars represent mean±s.e.m. NS, not significant.

