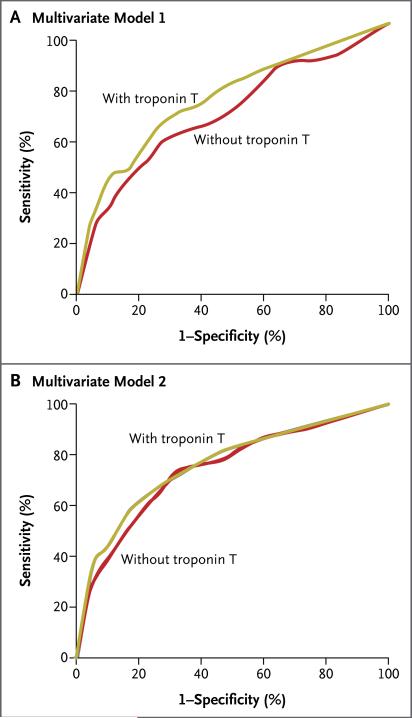
Figure 3. Covariate-Adjusted Receiver-Operating-Characteristic Plots for the Use of High-Sensitivity Cardiac Troponin T to Predict the Risk of Cardiovascular Death.
Panel A shows the curves for the model adjusted for treatment assignment, age, sex, smoking status, and high-sensitivity C-reactive protein level. Panel B shows the curves for the model that included these with the addition of the N-terminal pro–brain natriuretic peptide level.

