
Figure 2.
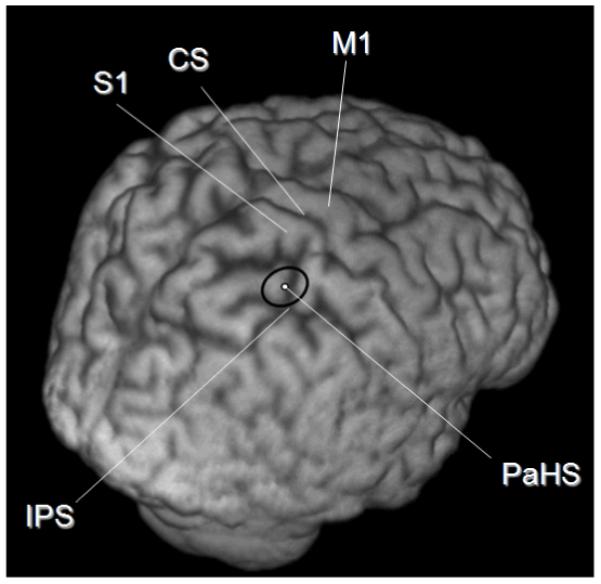
The position of the ‘Parietal Hotspot’ (PaHS) averaged over 9 subjects’ structural MR scans. CS = Central Sulcus, M1 = Primary Motor Cortex, S1= Primary Somatosensory Cortex, IPS = Intra Parietal Sulcus, PaHS = ‘Parietal Hot Spot’. The coordinates of the coil location at the end of the hunting procedure (see main text) as reported in MNI space (ICBM152 template) and using the Talairach stereotaxic convention (Talairach & Tournoux, 1988),were averaged. The coordinates were transformed using the FLIRT programme (FSL 3.2 package, fMRIB, University of Oxford, UK; http://www.fmrib.ox.ac.uk/fsl/) from native space to normalized structural image space. The black ellipse represents the 95% confidence limits. Note that the long-axis of the ellipse lies in the same direction as the TMS coil handle and short axis of the coil, along which the induced magnetic field is more variable. The narrower axis of the ellipse lies along the long axis of the figure of 8 coil where the magnetic field induced is less variable. This may explain the elliptical shape of the 95% confidence limits on site location shown.