Fig. 5.

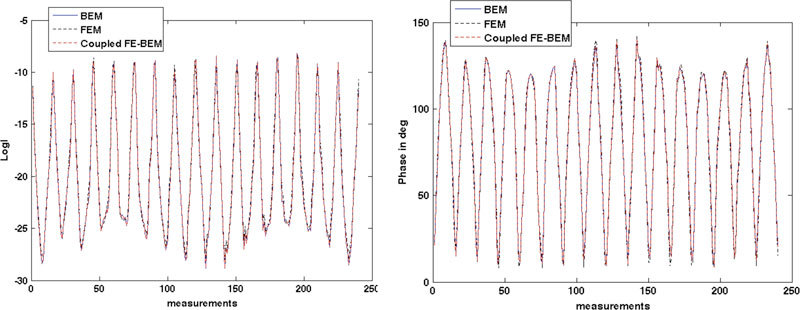
Comparison of (a) logarithm of intensity and (b) phase at the detector locations on the boundary ( = 240 measurement points) obtained from BEM, FEM and coupled FE-BEM for test case 1.

Comparison of (a) logarithm of intensity and (b) phase at the detector locations on the boundary ( = 240 measurement points) obtained from BEM, FEM and coupled FE-BEM for test case 1.