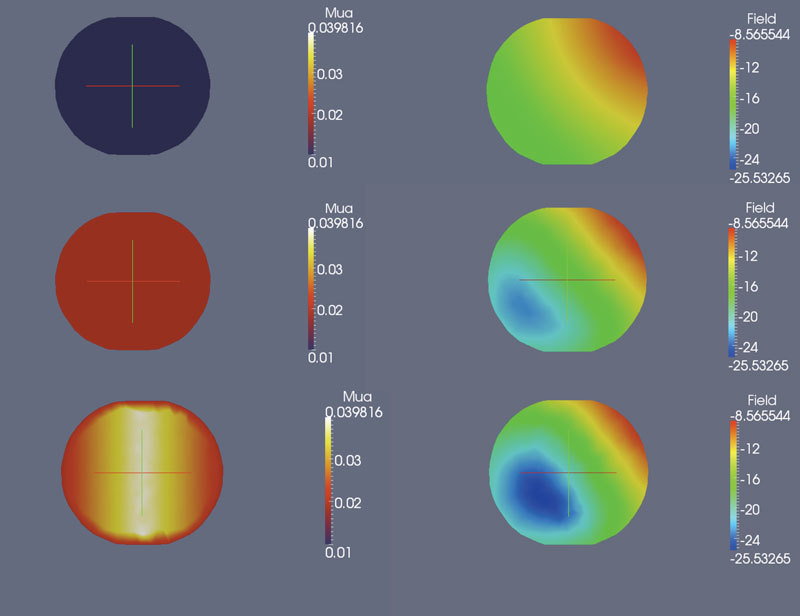
Fig. 6.

2-D cross-sections along the center of the interior spherical inclusion in test case 2 for (left column) and logarithm of fluence (right column). The background was always homogeneous. Top row shows cross-section of sphere for a homogeneous domain (1:1 contrast between sphere and background), Middle row shows 2:1 contrast between sphere and background and bottom row shows a spatially varying distribution in the sphere (2:1 varying). As expected the fluence decreases with increasing heterogeneity.
