
Fig. 7.
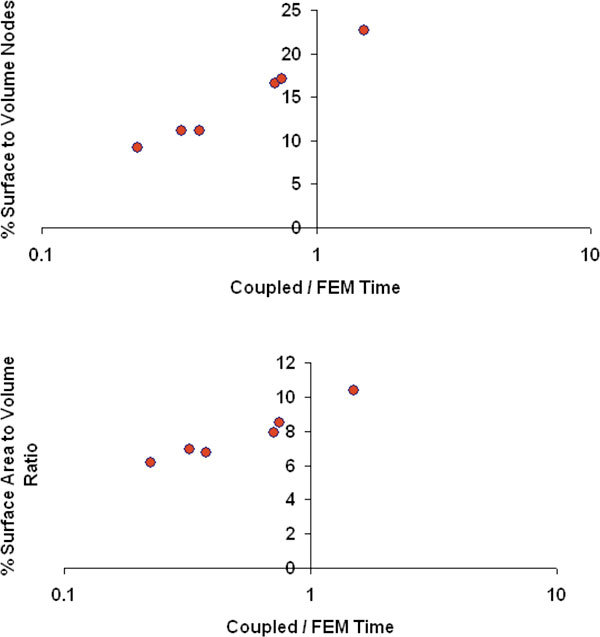
Ratio of computational time of coupled FE-BEM to stand-alone FEM for the six test cases, plotted as a function of % surface to volume nodes (top) from the respective meshes (Ns/N) where Ns is the number of boundary nodes in the coupled mesh and N is the number of nodes in the FEM mesh and % surface area to volume ratio (bottom) of the total tissue domain.