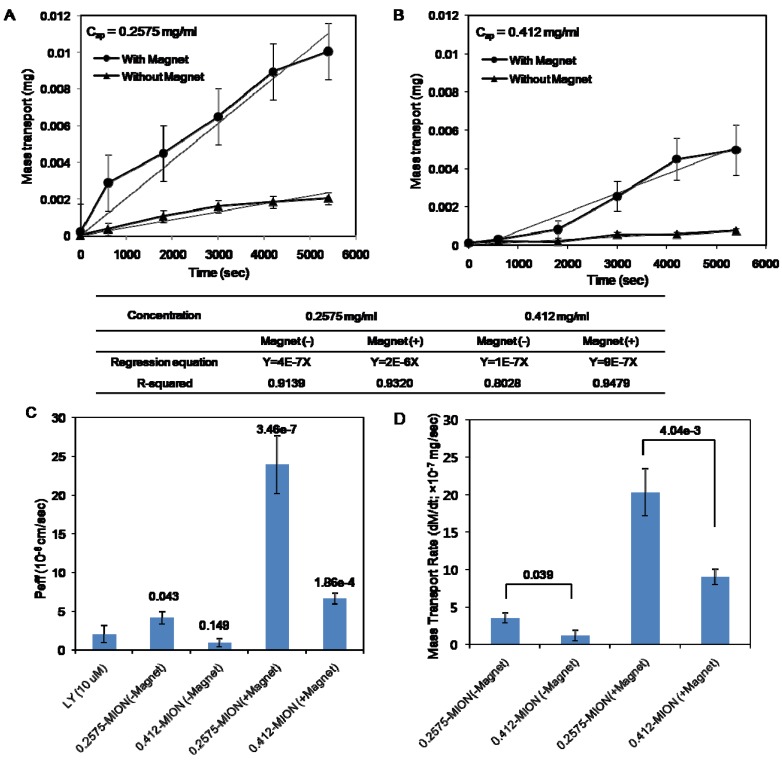
Figure 4.
Quantitative analysis of apical-to-basolateral (AP-to-BL) mass transport of Hep-MION across MDCK cell monolayers. Transport experiments across confluent monolayers were performed with Hep-MION dispersions at 0.2575 (A) or 0.412 mg/mL (B) in HBSS with 10% FBS. Experiments were performed in triplicates and standard error bars are shown. Equations and R2 values of the regression lines of mass transport as a function of time for the apical concentration (Cap; 0.2575 and 0.412 mg/mL) are displayed in the table. (C) The permeability coefficient, Peff values of the nanoparticles (Cap; 0.2575 and 0.412 mg/mL) were compared with the permeability of Lucifer Yellow (LY). P-values of t-test results are indicated over the each bar. (D) The mass transport rates (dM/dt) of the nanoparticles (Cap; 0.2575 and 0.412 mg/mL) were displayed with p-values of t-test results to show the different effects of concentration of Hep-MION on the transcellular transport in the presence or absence of the applied magnetic field.

