
Figure 6. FRAP analysis suggests an in vivo interaction between klp9p and ase1p.
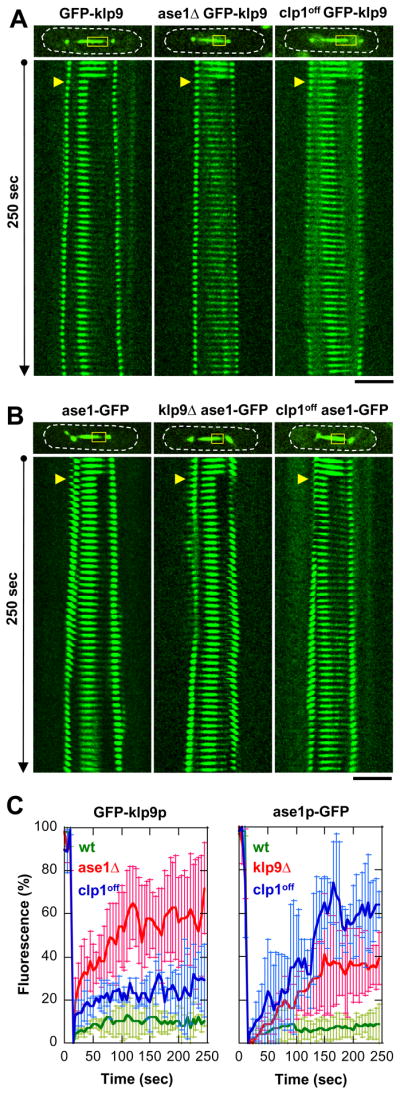
(A) Coarse kymograph of fluorescence recovery of cells expressing GFP-klp9p under the wildtype, ase1Δ, or clp1off cell background. Note that cells also express alp4p-GFP spindle pole marker to show precise spindle length and the timing of anaphase B. Yellow boxes, bleached region. Yellow arrows, FRAP start. Bar, 5 μm.
(B) Coarse kymograph of fluorescence recovery of cells expressing ase1p-GFP under the wildtype, klp9Δ, or clp1off cell background.
(C) Comparative plots of fluorescence recovery after bleaching. Shown are normalized fluorescent signals with pre-bleached at 100% (mean ± sd). Left panel, GFP-klp9p in wildtype (green), ase1Δ (red), and clp1off (blue). Right panel, ase1p-GFP in wildtype (green), ase1Δ (red), and clp1off (blue). Note the relatively higher mobility of klp9p and ase1p in the mutant backgrounds compared to wildtype.