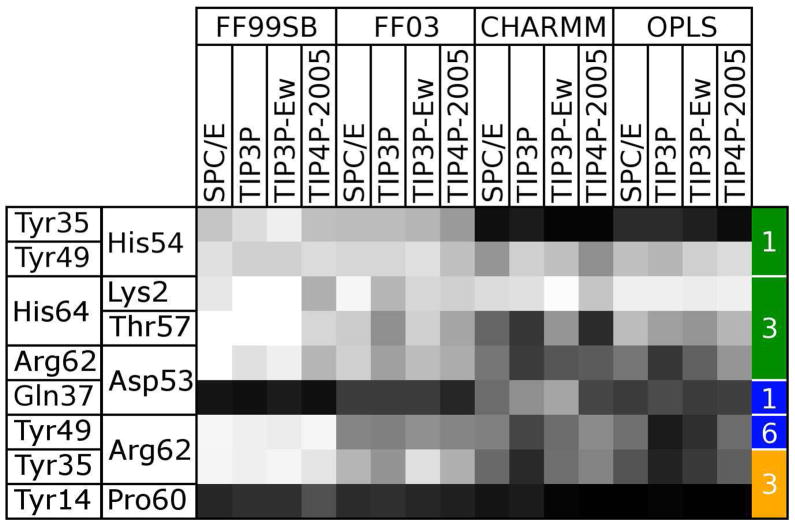
Figure 12. Evolution of specific contacts identified in the 1AHO crystal structure over the course of 16 simulations.
The occupancy of each specific contact listed in Table 5 at the final frame of each trajectory is shown as a shaded square. Each column represents a separate force field and water model combination. Black squares indicate that a contact has been completely lost, while white squares indicate that a contact has been maintained. The residues involved in each contact are listed on the left side of the table, and the type of contact and interface it spans are indicated by the colored, numbered boxes on the right: green, hydrogen bonds involving only backbone atoms; blue, hydrogen bonds involving side chain atoms; yellow, hydrophobic contacts.

