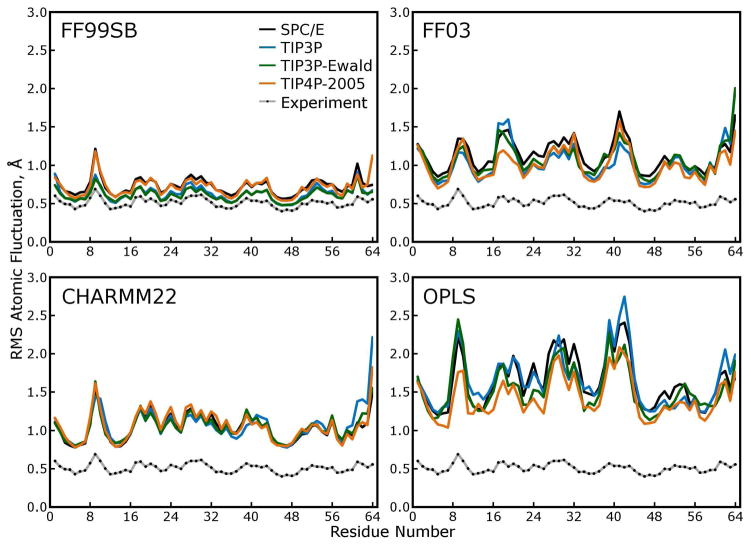
Figure 8. Atomic root mean squared (RMS) fluctuations of.
α carbons. These fluctuations were calculated after using the symmetry operations of the P212121 space group to superimpose all 48 asymmetric units (protein monomers) in each simulated lattice and are thus directly comparable to the scaled roots of crystallographic B-factors, as shown in each panel. Larger RMS fluctuations in a simulation rarely indicate tremendous mobility of a particular region of the protein in any of our simulations. Rather, as shown by comparing these results to those of Figure 9, higher RMS fluctuations indicate more lattice disorder, increased rigid-body motions of the individual protein subunits within the lattice.

