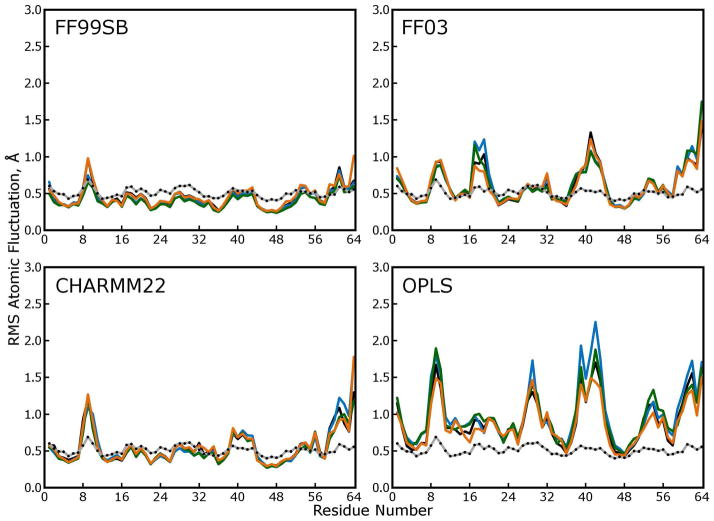
Figure 9. Atomic fluctuations obtained by quaternion alignments of protein backbones.
In the main text, atomic fluctuations were computed based on the distribution of each atom as obtained in the lattice rmsd calculation (see above), which we believe is the best approximation to the distribution described by crystallographic “B factors” that our simulations can yield. In the plots above, atomic fluctuations were computed based on the distribution of each atom obtained after optimal quaternion alignments of the protein backbones. This method, which is used to compare fluctuations in solution-phase experiments to crystallographic B factors, omits “lattice disorder” from the calculation and therefore lowers the observed fluctuations. Comparison of these plots to Figure 8 shows that fluctuations obtained from simulations with the FF99SB forcefield (which closely reproduce the experimental B factors) contain very little lattice disorder. In contrast, simulations with other force fields produce significant lattice disorder as well as wider variability in protein backbone conformations. Together with the lattice RMSD measurements, these plots suggest that, in simulations with the FF03, CHARMM22, and OPLS force fields, proteins are shifting away from their initial positions in the lattice in many different ways—the original symmetry is being destroyed and the lattice is melting.

