
Fig. 3.
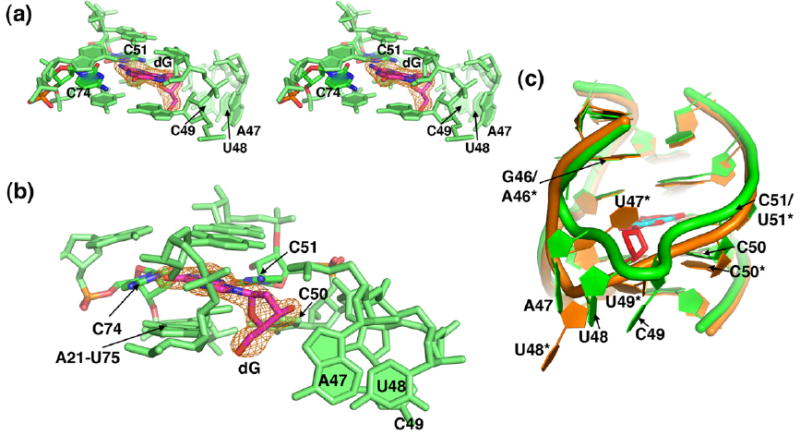
X-ray crystal structure of the binding pocket of GdG-3 bound to dG. In (a)–(c), the GdG-3 aptamer is shown in green; in (c), the xpt riboswitch is shown in orange. Molecular model images of GdG-3 shown in (a)–(c) are from protomer A of the asymmetric unit. In (a) and (b), images are taken from a simulated annealing omit map contoured to 1σ and calculated with the dG ligand omitted. The dG ligand is shown in magenta; oxygen atoms from dG, C74 (forming a Watson–Crick pair with dG), and C51 (contacting the minor groove face of dG) are shown in blue; and nitrogen atoms are shown in red. (a) A stereo view of the ligand-binding pocket. (b) The image shown in (a) is rotated ~90° to the left. (c) An overlay of GdG-3 bound to dG (cyan), with the xpt aptamer bound to hypoxanthine (red), is shown. All images were prepared in PyMOL.33