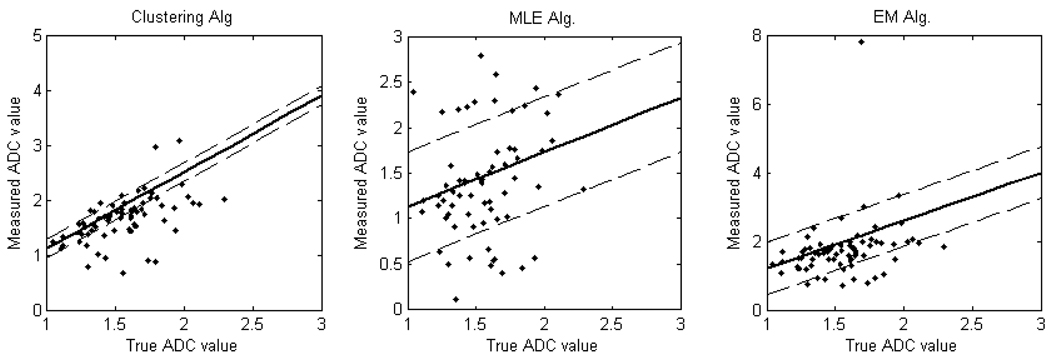
Figure 1.
The plots of regression lines using the no-gold-standard method. The solid line is generated using the estimated linear model parameters for each segmentation algorithm. The dashed lines denote the estimated standard deviations for each algorithm. The scatter plots show the computed ADC values vs. the true ADC value for (a) Clustering-based (b) MLE-based and (c) EM-based segmentation.

