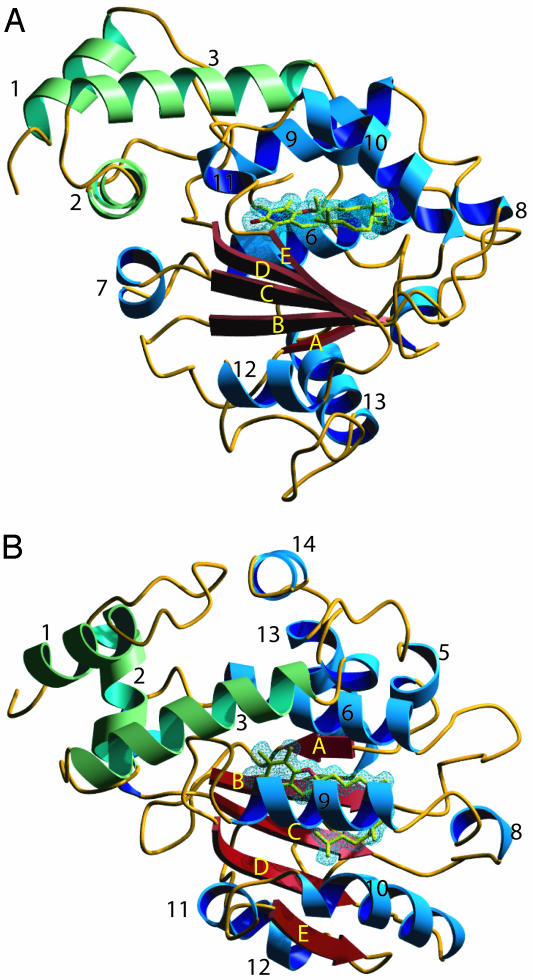
Fig. 1.
Secondary structure of ATTP. (A) Ribbon diagram of ATTP viewed down the β-sheet. (B) View after rotation of A by 90° on horizontal axis. α-T is colored in yellow. The N-terminal domain helices are indicated in green, and the C-terminal domain helices are indicated in blue and strands are indicated in red. The 2 Fo – Fc electron density that covers α-T is drawn as a blue mesh at 1 σ. Images were generated with povscript (36) and rendered with povray.

