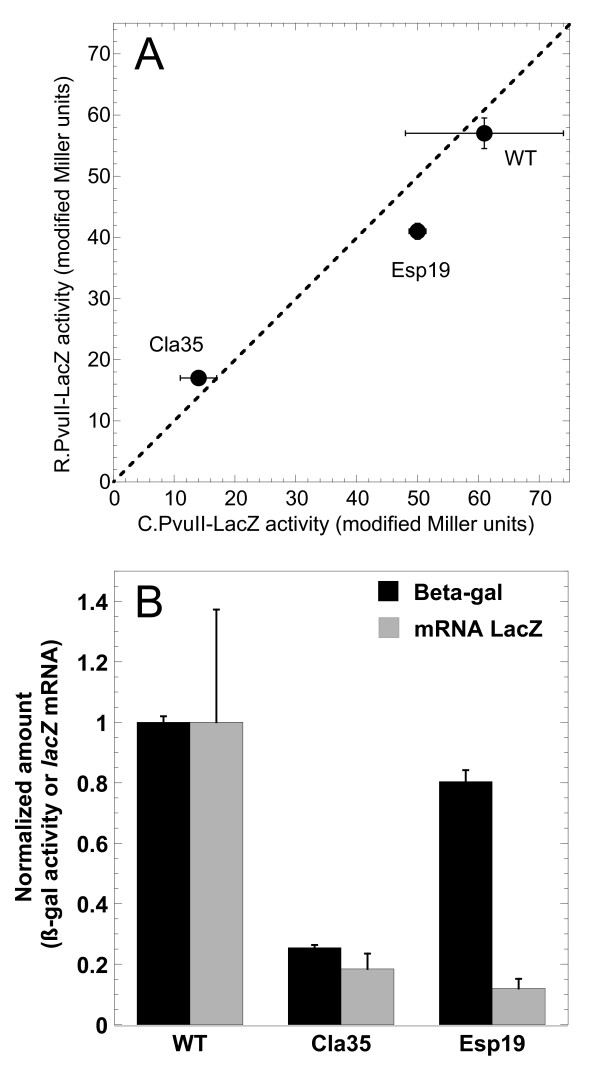
Figure 6.
Effects of pvuIIC mutation. A. Comparison of pvuIIC and pvuIIR translation with WT and mutant variants of pvuIIC. The slopes from triplicate experiments such as that shown in Figure 4 are plotted, showing standard errors (where bars are not visible, errors were smaller than the symbol). In this correlogram, activity from the pvuIIC-lacZ translational fusion is shown on the x-axis, and that from the pvuIIR-lacZ fusion of the same mutant is on the y-axis; if the two fusions for a given variant have equal translation, the point would fall on the dotted line. B. Effects of mutation on mRNA levels and translation activity of pvuIIR-lacZ fusions. Reporter pvuIIR fusions with WT pvuIIC upstream, or with the Cla35 (frameshift) or Esp19 (in-frame) pvuIIC mutations, were grown in triplicate. Real-time RT-PCR was carried out as described in Methods, using the SYBR green method [60] and primers specific to lacZ. Quantitation was based on a standard curve with normalization to recA mRNA. Amounts of mRNA (gray bars) are normalized to the level in the strain carrying WT pvuIIC. The black bars indicate lacZ activity measurements in the same cultures, measured as shown in Figure 4 and normalized to the WT value. Standard errors are shown.

