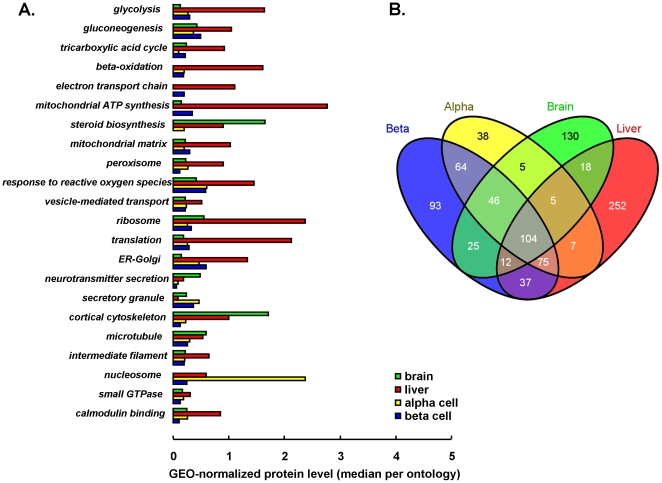
Figure 1. Overview of detected proteomes.
Panel A. shows functional pathways that are statistically enriched in the detected proteomes (p<0.001); for each pathway (gene ontology), the average protein level, after geometric normalization, is shown for each of 4 tissues so that relative importance of these pathways can be quantitatively estimated between tissues. Venn diagram in panel B. shows the number of protein identifications in each tissue and their overlaps denoting overall proteome similarity.

