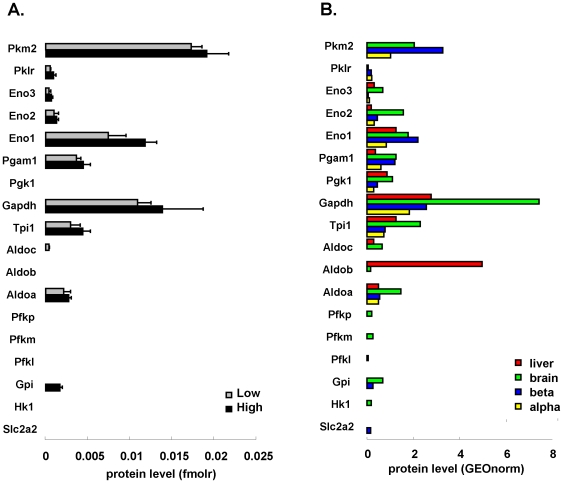
Figure 4. High glucose responsiveness is associated with higher molar expression of glycolytic enzymes.
Comprehensive view on all enzymes of glycolysis detected in highly (black bars) and lowly (gray) glucose responsive beta cells (panel A, fmolr representing relative molar amount units, non-normalized) and in rat tissues (B, GEOnorm indicates geometrically-normalized units using 6 reference proteins). Enzymes from start to end of the pathway are represented sorted from bottom (proximal glycolysis) to top (distal glycolysis). Enzymes denoted by their NCBI gene name; absent bars indicate protein level below limit of quantification.

