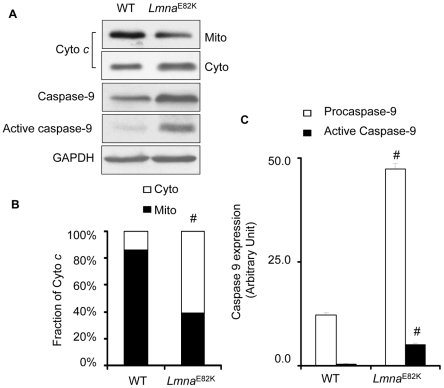
Figure 6. Detection of cytochrome c release and activation of caspase-9.
(A) Mitochondrial cytochrome c release and the expression of caspase-9 were measured by western blot from the hearts of NTG and Lmna E82K transgenic mice, and a representative experiment was shown. (B–C) The quantitative analysis of cytochrome c and caspase-9 using GADPH as normalization (n = 3, # P<0.001 versus NTG mice).

