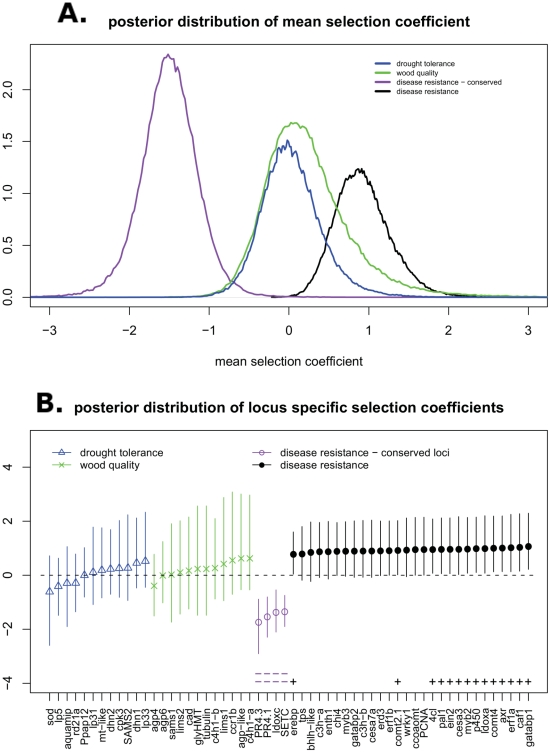
Figure 2. MKPRF analysis showing the posterior distribution of the mean selection coefficient across groups of loci (panel A), and the mean and 95% credible interval of the posterior distributions for per-locus selection coefficients (panel B).
A selection coefficient less than zero implies selective constraint at amino acid replacement sites while a coefficient greater than zero implies accelerated fixation of amino acid replacements.

