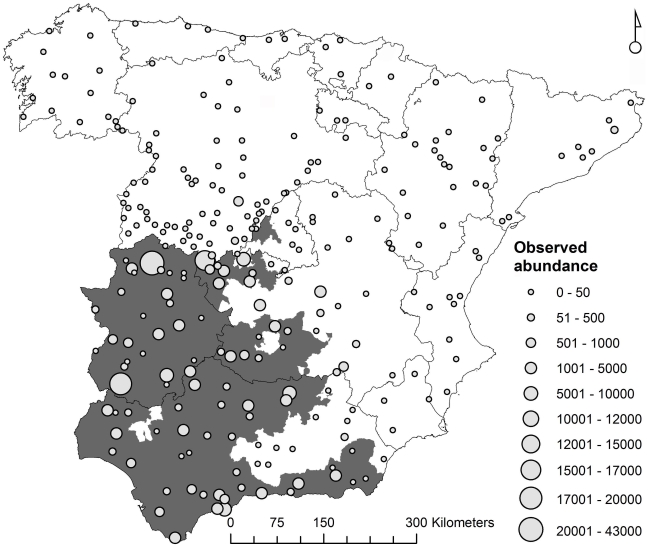
Figure 1. Location of the sampling localities.
Spatial distribution of the sites (UTM 10×10 km squares) in which the abundance of Culicoides imicola was recorded (n = 263) by the Spanish national bluetongue surveillance programme between 2005 and 2008 (symbol size is proportional to the maximum number of C. imicola captures per night). These were used as a training dataset to forecast the species abundance in peninsular Spain. Regional veterinary units in which bluetongue outbreaks were declared in livestock in 2007 are shown (grey areas).

