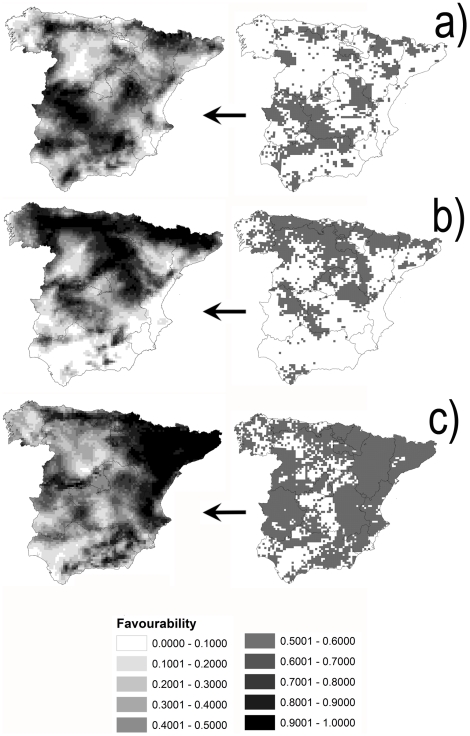
Figure 2. Maps of potential wild hosts abundance.
Favourability, where 0 represents minimum favourability and 1 represents maximum favourability, in UTM 10×10 km squares for potential wild hosts of Culicoides imicola: red deer (a), roe deer (b) and wild boar (c). Current distributions of these species, referring to 10×10 km UTM grid cells, are depicted in the maps of the right; adapted from [49].

