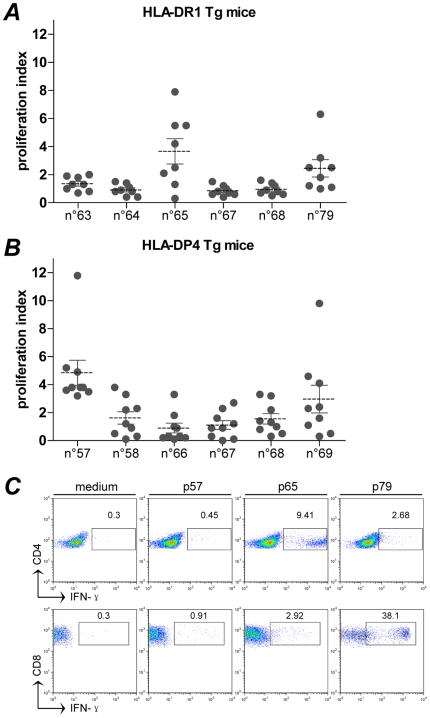
Figure 2. Evaluation of the T cell response in transgenic mouse models following gWiz-F immunization.
A, B, splenocytes proliferation assay. Splenocytes from immunized HLA-DR1 (n = 8) (A) or -DP4 (n = 9) (B) transgenic mice were stimulated individually with peptides spanning the F protein as described in Materials and Methods. Only six peptides represent in each plot. Responses are expressed as a proliferation index. Individual data are shown by the circular plots. The dotted lines correspond to the mean values of the stimulation index for each group (>2 considered positive). C, intracellular staining of IFN-γ. Splenocytes from a representative HLA-DR1 mouse receiving gWiz-F immunization were re-stimulated by p57, p65 and p79 respectively. CD4+ or CD8+ lymphocytes were specially gated for the IFN-γ detection.

