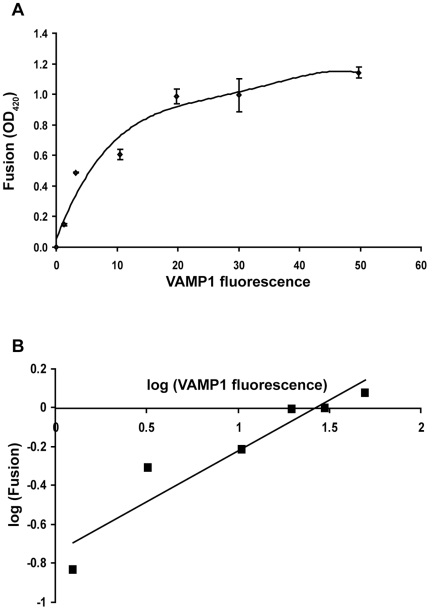
Figure 7. Dependence of cell fusion activity on cell surface density of VAMP1.
(A) v-cells were cotransfected with tTA (1 µg per 10 cm2 growth area) and increasing amount of the flipped VAMP1 plasmid (per 10 cm2 growth area): 0.01, 0.02, 0.05, 0.1, 0.2 and 0.5 µg. After the v-cells were combined with the t-cells expressing syntaxin1/SNAP-25 for 24 h, cell fusion was quantified. In parallel experiments, the expression level of VAMP1 proteins at surface of the v-cells was determined by staining with the anti-Myc antibody and FACS analysis. A polynomial regression curve was generated to model the relationship between cell fusion activity (OD420) and mean fluorescence intensity of VAMP1 staining. Error bars represent standard deviation of three independent experiments. (B) Log-log plot of cell fusion activity vs. mean fluorescence intensity of VAMP1 staining. The solid line shows a linear regression, which yields a slope of 0.52 with a correlation coefficient of 0.901.

