
Figure 1.
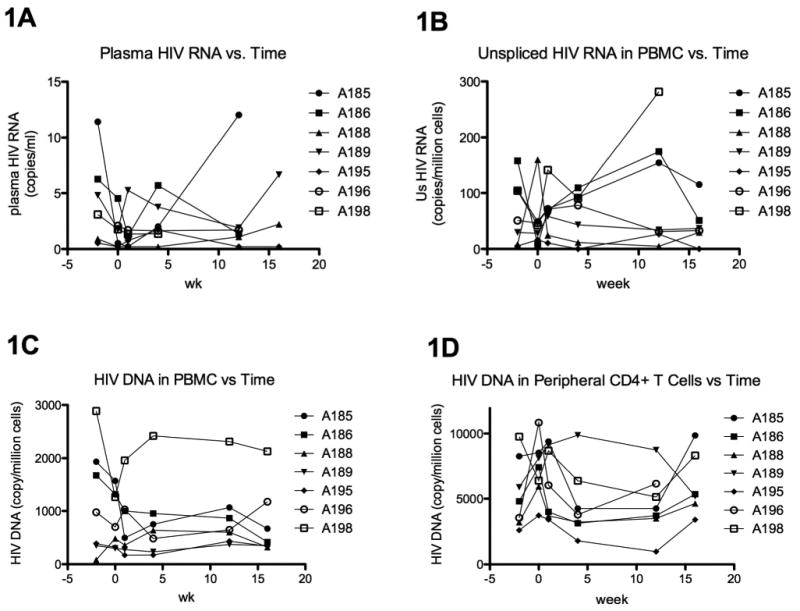
Blood HIV levels as a function of time through week 16. 1A shows the plasma HIV RNA, as measured by the high volume plasma HIV RNA assay. 1B shows the cell-associated unspliced HIV RNA in peripheral blood mononuclear cells (PBMC), as measured by real time reverse transcriptase PCR. 1C-D show the cell-associated HIV DNA in PBMC (1C) and sorted peripheral CD4+ T cells (1D), as measured by real time PCR. The x-axis shows the study week. Intensification was started after week 0 and stopped at week 12.