
Figure 2.
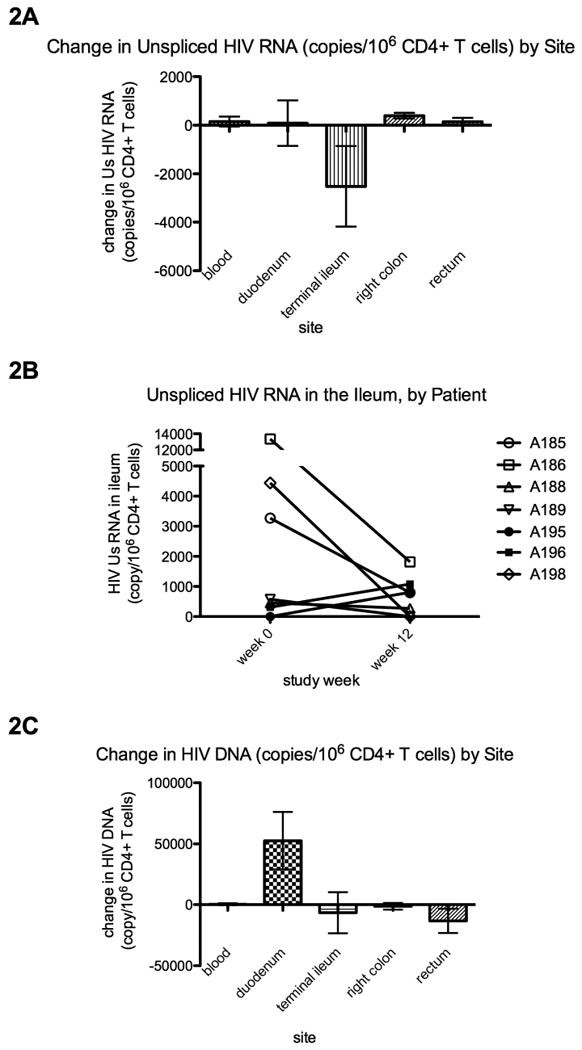
Change in cell-associated unspliced HIV RNA (2A-B) and HIV DNA (2C) per 106 CD4+ T cells. HIV copy numbers were measured by real time PCR, normalized for the total cell input into the PCR (by μg RNA or DNA), and then normalized to the percent of all cells that were CD4+ T cells (by flow cytometry). 2B shows the HIV RNA values in the ileum for each subject at weeks 0 and 12. In 2A and 2C, column heights indicate the average of the changes (week 12-week 0) in HIV copy number per 106 CD4+ T cells, as measured from peripheral blood mononuclear cells or total gut cells (obtained by collagenase digestion of endoscopic biopsies) from each of the four gut sites. Error bars indicate the standard error of measurement (SEM).