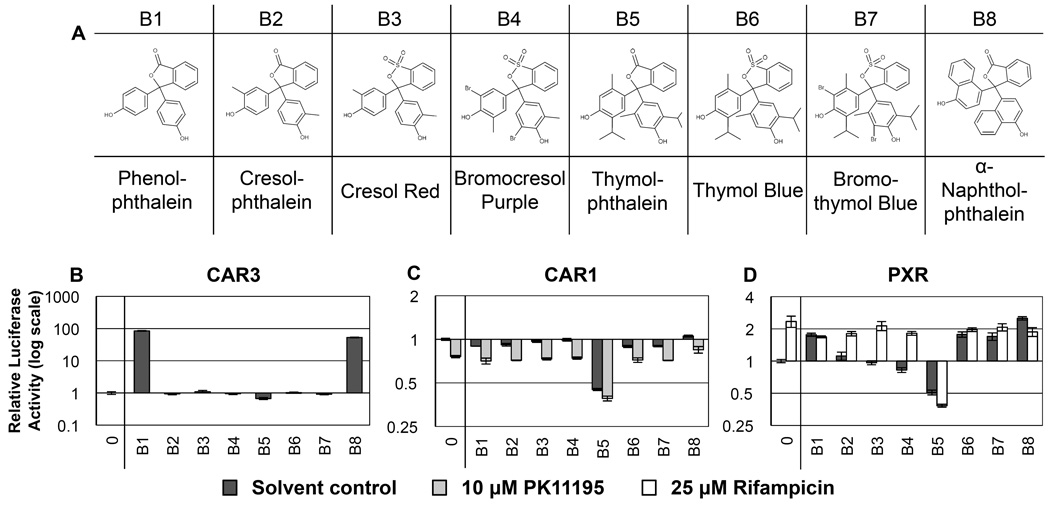
Figure 2. RQSAR for group B - Phthaleins.
(A) 2D structures of group B phthaleins. (B) CAR3-driven relative luciferase activity, (C) CAR1, and (D) PXR treated with 10 µM test compound, plotted using log scales. 0 = DMSO solvent control. Cotreatments were PK11195 (10 µM) for CAR1 and rifampicin (25 µM) for PXR. (n=4 except for B: B1 n=7, B2–8 n=8. C: B1 n=3).

