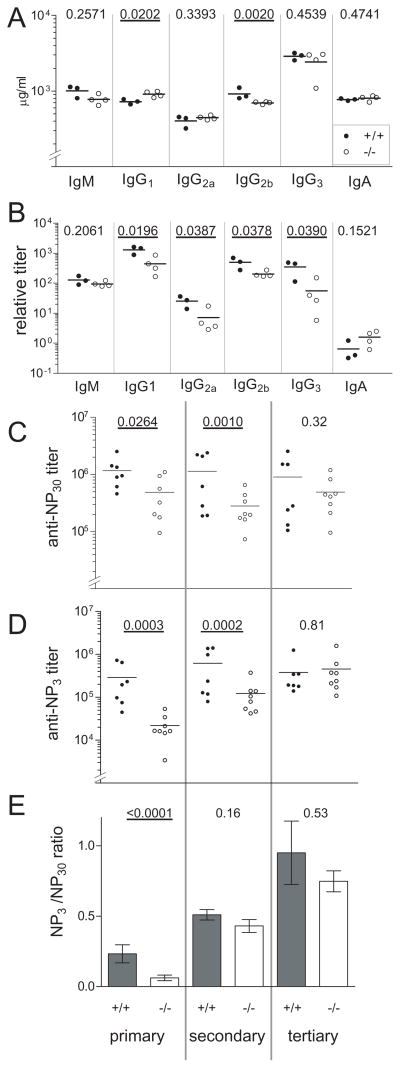
Figure 4.
T-cell dependent antibody response is defective in the absence of cyclin D3. Column scatter plots display ELISA data for KO (white) and WT controls (black) mice. Each point is an individual animal. Statistical analysis is detailed in the Materials and Methods section. Significant p values (<0.05) are emboldened and underlined. (A) Resting Ig levels. (B) NP-specific antibodies 13 d after primary immunization. ELISA plate coat was NP20-BSA. NP-specific titers for each subclass are given in arbitrary units. (C–D) NP-specific IgG1 levels. Serum samples were collected 13 days after the primary immunization (“primary”) and five days after each boost (“secondary” and “tertiary”, see Supplemental Figure 2 for experimental scheme). In (C) the plate coat was NP30-BSA, which binds low- and high-affinity antibodies. In (D) the plate coat was NP3-BSA, which binds only high-affinity antibodies. In E, the ratio of NP3 to NP30 binding is plotted as an index of affinity maturation. Error bars are SEM.

