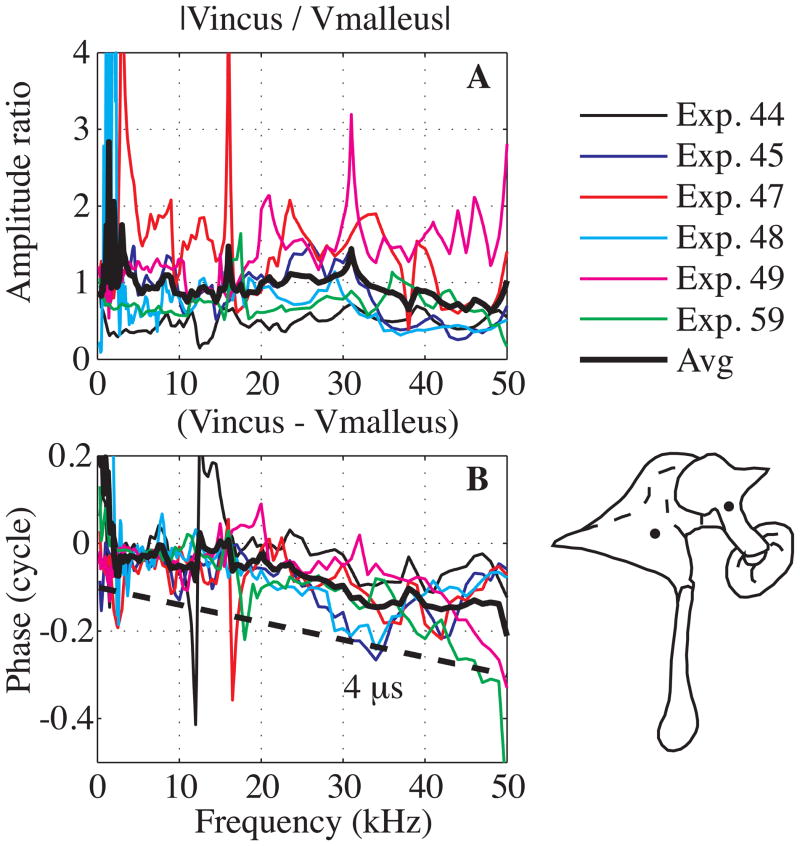
Fig. 8. Velocity amplitude and relative motion across the malleus-incus joint (color online).
A: amplitude ratio, B: relative phase compared to a theoretical delay of 4 μs (dashed thick line). The dots in the diagram illustrate the approximate recording positions on the malleus and incus. Results are from six experiments as indicated in key. Black thick line is the average. (Exp#44 R#14, 23, Exp#45 R#22, 27; Exp#47 R#24, 29; Exp#48 R#22, 23; Exp#49 R#23, 30; Exp#59 R#10, 30).

