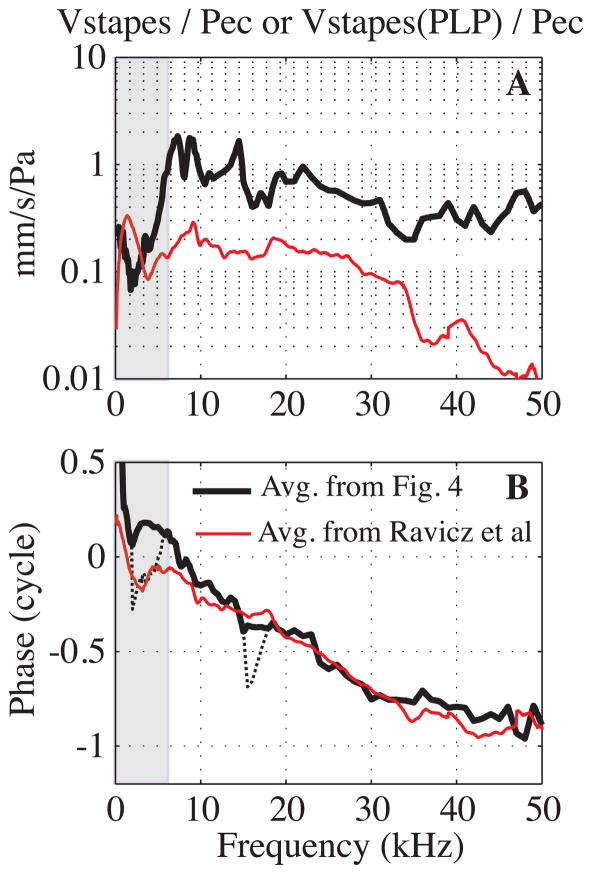
Fig. 9. Grouped results from the literature: stapes velocity relative to EC pressure (color online).
A: Amplitude. The thick black line is the average of our data from Fig. 4 (Exp#48, 50 and 53). The thin red line is from (Ravicz et al., 2008), as presented in their Fig. 12. B: Phase. The black thick line corresponds to the average phase from our Fig. 4 data with Exp#48 phase jump excluded and the thin black dotted line includes the phase jump in the average. The thin red line is from Ravicz et al.

