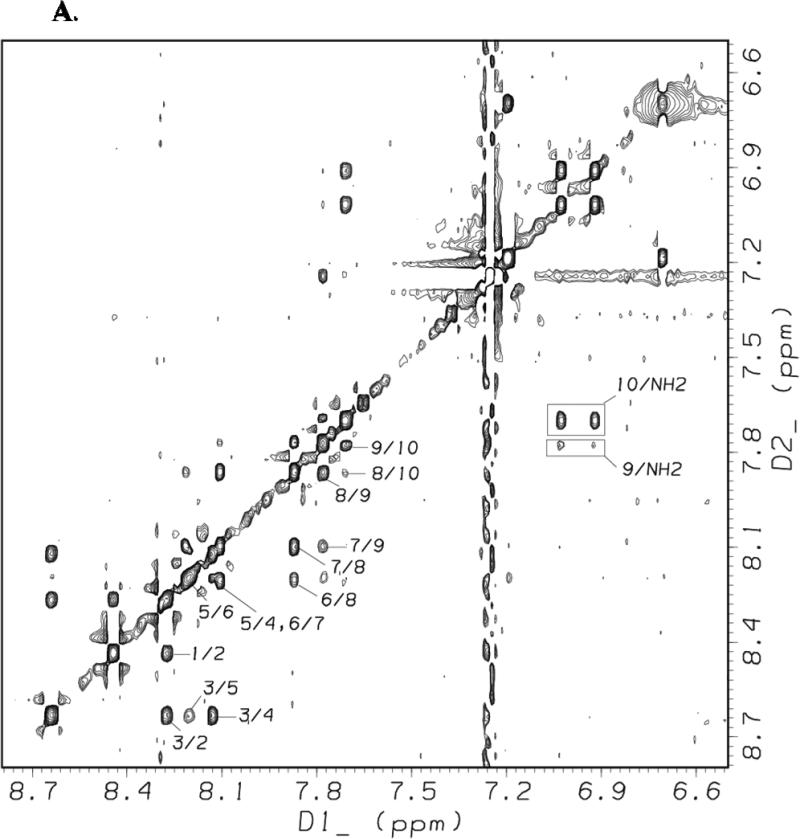
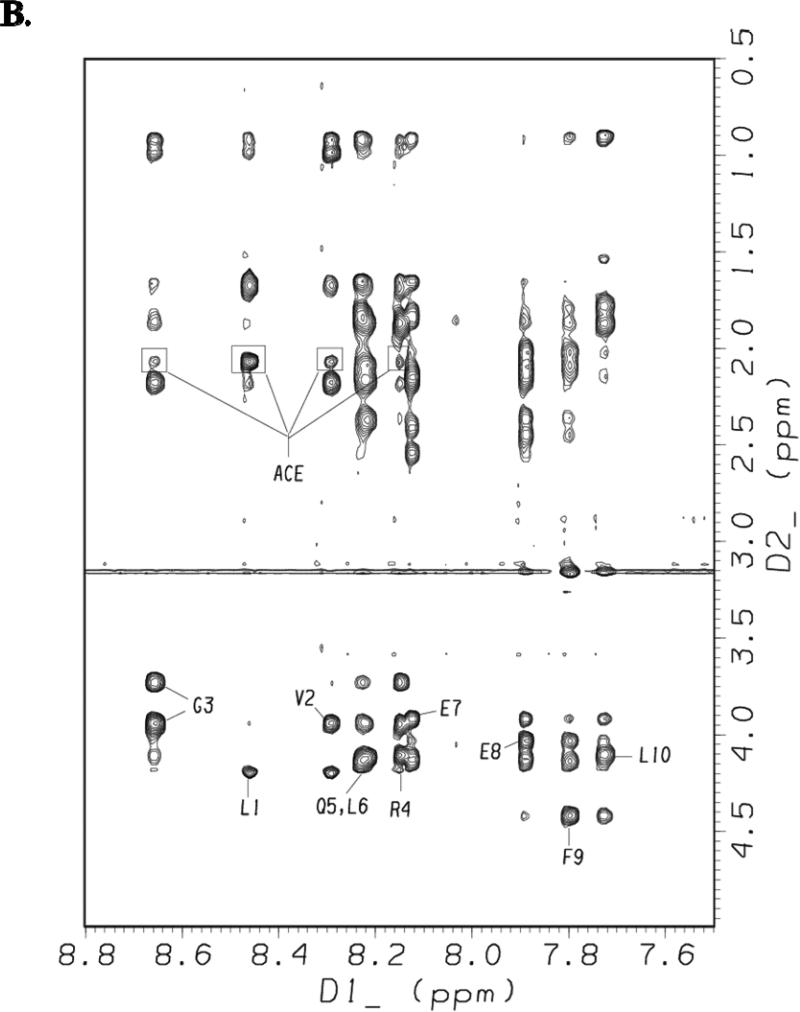
Figure 8. NOESY spectrum of [113-122]apoJ in DPC micelle shows characteristic NOEs of an α helical structure.
Amide/aromatic (A) and fingerprint (B) regions of the NOESY spectrum (mixing time 200 msec) of [113-122]apoJ in DPC micelle in 5mM potassium phosphate, pH 5.5, at 37°C. The spectrum was obtained as described in Figure 4. In A, sequential dNN(i,i+1) and the observed dNN(i,i+2) NOEs are labeled. Also labeled are the observed NOEs between residues Phe9 and Leu10 and C-terminal amide (NH2) blocking group. In B, intraresidue HN/HA NOEs as well as observed NOEs between N-terminal acetyl group (ACE) and other peptide protons are labeled.


