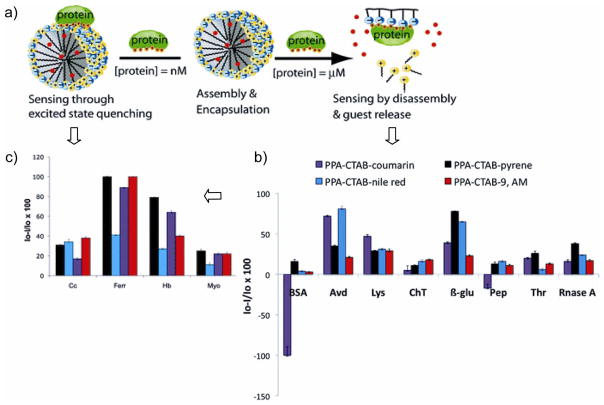
Figure 2.
a) Schematic of the fluorescence response due to metalloproteins/nonmetalloprotein either due to the disassembly or due to the energy/electron transfer based quenching for metalloproteins. b) Analyte-dependent patterns from emission changes at 8 μM concentration of the nonmetalloprotein. c) Analyte-specific sensing patterns for metalloproteins with different dye molecules at 80 nM concentration of proteins (coumarin (10−6 M; λex = 400 nm); pyrene (10−6 M; λex = 339 nm); nile red (10−6 M; λex = 550 nm); 9-anthracene methanol (10−5 M; λex = 365 nm)). Figure reproduced with permission from reference [26].

