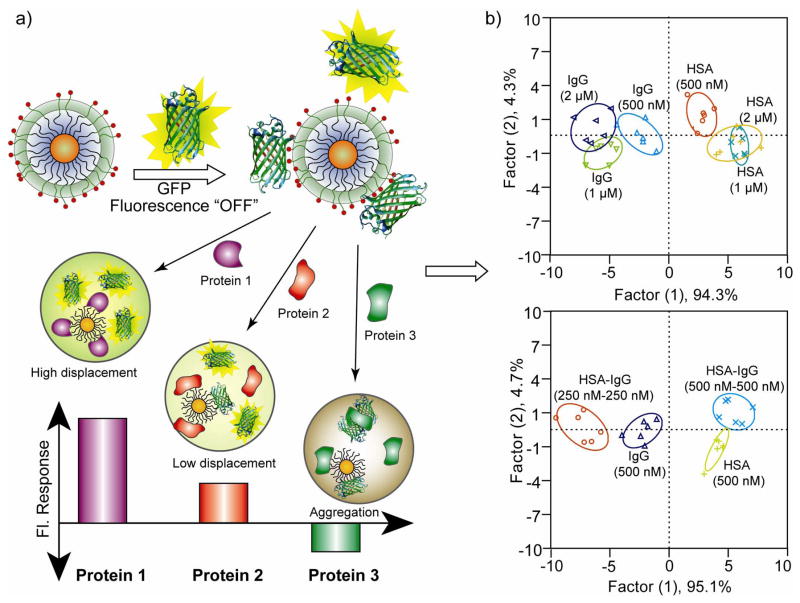
Figure 3. GFP-NP sensor array.
a) Schematic illustration showing the competitive binding between proteins and quenched AuNP-GFP complexes whose aggregation leads to the fluorescence “turning on” or further quenching using a library of cationic nanoparticles. b) Discrimination of HAS and IgG at different concentrations and mixture of proteins. At the top, canonical score plot for the fluorescence patterns as obtained from LDA for HAS and IgG at different concentrations (500 nM, 1 μM, and 2 μM) with 95% confidence ellipses. At the bottom, HAS and IgG were mixed at 1:1 molar ratio with 250 nM each and 500 nM each, and added to five AuNP-GFP complexes. The canonical score plot obtained from LDA analysis were compared with those for the 500 nM individual proteins [31].

