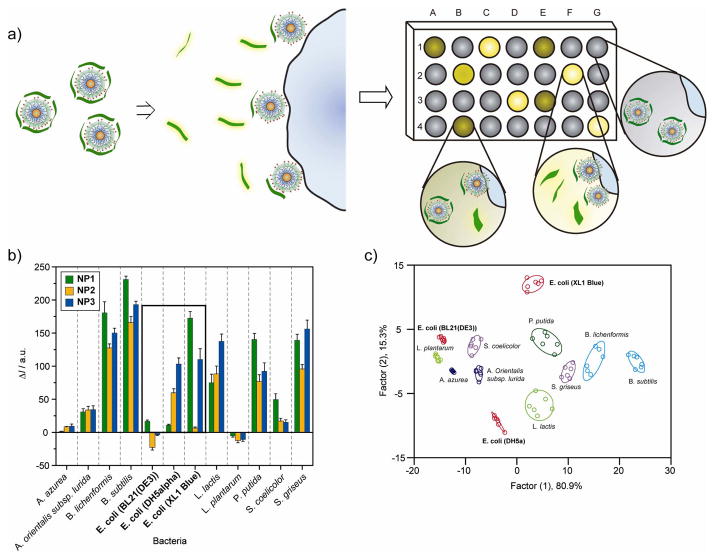
Figure 5.
Array-based sensing of bacteria. a) Schematic diagram of the displacement assay between bacteria and the NP-PPE complex. b) Fluorescence response (ΔI) patterns of the NP-PPE sensory array against various classes of bacteria (2×10⁵ bacteria/mL). As shown on the plot, the same strains of bacteria can also be identified. c) Canonical score plot for the first two factors of simplified fluorescence response patterns obtained with NP-PPE assembly arrays against bacteria (95% confidence ellipses shown) [37].

