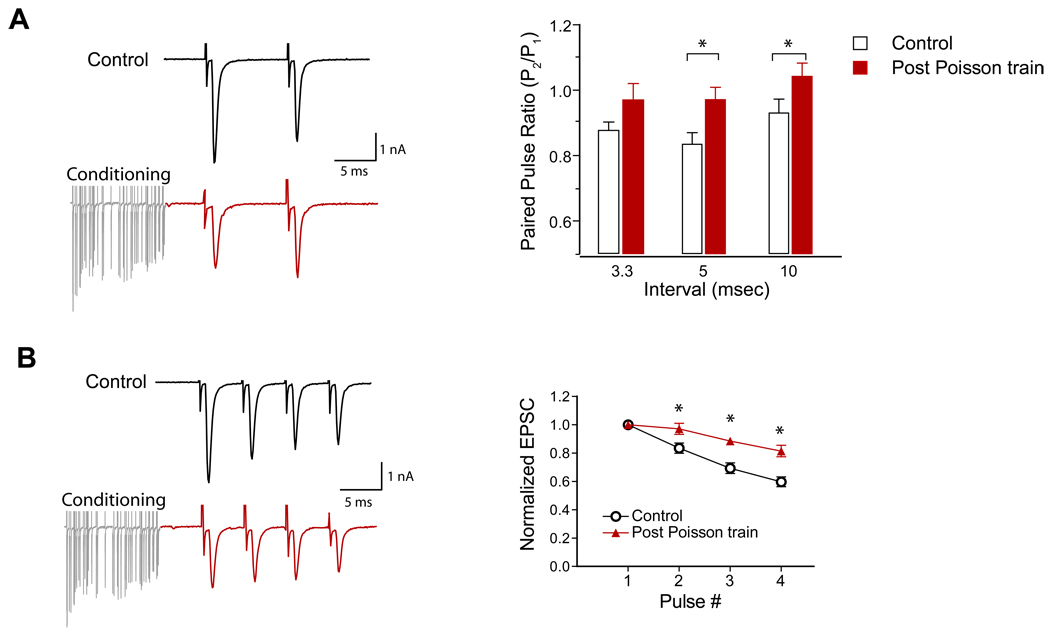
Figure 3.
Reduced release probability after 100 Hz Poisson-distributed spike trains. A, Left: exemplar EPSC paired-pulse traces from control (top) and after a 100 Hz Poisson conditioning train (red). Right: paired-pulse ratios at quiescence were 0.88±0.03, 0.83±0.04 and 0.93±0.04 for 3.3, 5 and 10 ms intervals, whereas the PPRs increased to 0.97± 0.05 (p=0.061, n=8, 1-tailed t-test), 0.93±0.04 (p=0.011), and 1.04±0.04 (p=0.042) respectively for 3.3, 5 and 10 ms intervals after the 100 Hz Poisson trains. B, Left: exemplar EPSCs of 4 pulses (200 Hz) from control (top) and after a 100 Hz Poisson spike train (red). Right: normalized EPSC amplitudes for the 4 pulses at 200 Hz in control and after the Poisson conditioning trains (p<0.0001, n=8, 2-way ANOVA, * denotes paired t-test p<0.05 for individual pulses.).

