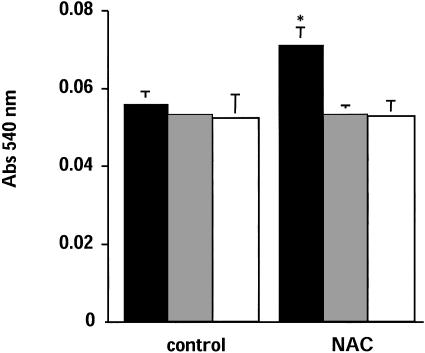
Fig. 6.
Quantitation of the effect of NAC on cell adhesion. Experiments were performed exactly as in Fig. 5. Cells were solubilized and eosin Y and absorbance was quantitated at 540 nm. No antibody, white bars; anti-VLA-4 (10 ng/ml), gray bars; and anti-VLA-4 (10 μg/ml), black bars. Data are means ± SE (n = 3).*, P < 0.01 vs. control.

