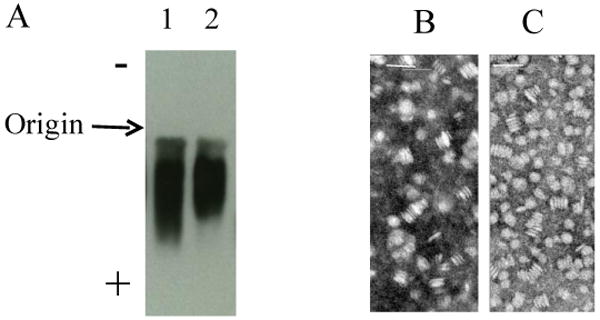
Fig. 4. Agarose gel electrophoresis and electron micrographs of HDL without and with curcumin.

Lipoprotein gel electrophoresis of HDL (1 μg apoE3-NT) (Panel A) was performed in an agarose gel. The electrophoresis was carried out at 80 V for 45 min followed by diffusion transfer of proteins to PVDF membrane and Western blot analysis using anti-apoE antibody (mAb1D7). Lane 1: HDL with curcumin; lane 2: HDL without curcumin. Electron microscopic analysis of HDL with (Panel B) or without curcumin (Panel C) was carried out following negative staining of the particles with 1% phosphotungstate. The bar represents 50 nm.
