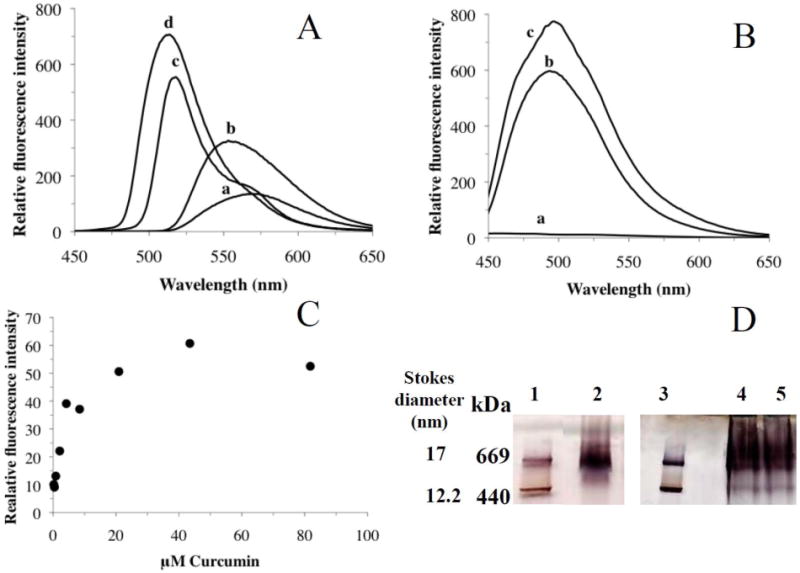
Fig. 5. Fluorescence emission spectra of curcumin.

Panel A shows fluorescence emission spectra of curcumin in solvents of varying polarity such as methanol (a), ethanol (b), tetrahydrofuran (c) and ethyl acetate (d) with dielectric constants of 33.0, 24.3, 7.5 and 6.0, respectively. The spectra were recorded between 450 and 650 nm following excitation at 420 nm. Panel B shows fluorescence emission spectra of curcumin in PBS (a), 0.1% TX-100 (b) or reconstituted HDL (15 μg protein) (c). Panel C shows the dose-dependent accumulation of curcumin in HDL. Curcumin (5 mM stock dissolved in DMSO) was added in incremental amounts to HDL (10 μg apoE protein) and incubated at 37 °C for 6 h. The fluorescence emission intensities at 495 nm were plotted versus the final curcumin concentration in the incubation mixture. A representative plot from 3 different experiments is shown. Panel D. Non-denaturing PAGE of HDL in the presence of varying amounts of curcumin. HDL was incubated with 0, 50 and 500 μg curcumin (added to 50 μg HDL protein) as described above, electrophoresced on a 4-20% acrylamide gradient (Lanes 2, 4 and 5, respectively) and stained with Amido Black. Lanes 1 and 3 show high molecular weight standards, thyroglobulin (669 kDa) and ferritin (440 kDa) bearing Stokes' diameter of 17 and 12.2 nm, respectively.
