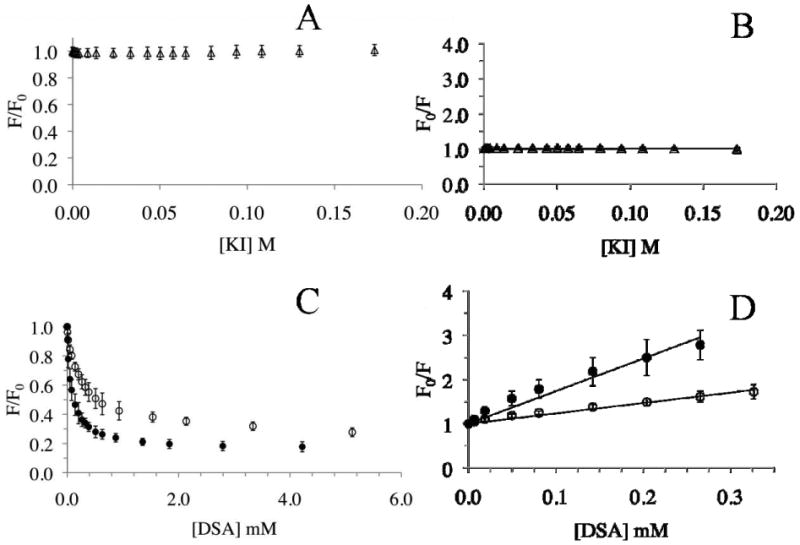
Fig. 6. Quenching analysis of HDL with curcumin.

HDL with curcumin (10 μg protein) was treated with increasing concentrations of KI in PBS (Panels A and B) or DOXYL-stearic acid in DMSO (Panels C and D), and the fluorescence emission intensity recorded at each concentration at 495 nm (excitation at 420 nm). KI, open triangles; 5-DSA, open circles, and 16-DSA, closed circles. The data are plotted as F/F0 versus quencher concentration (Panels A and C), or as the Stern-Volmer plot of F0/F versus quencher concentration (Panels B and D). The Stern Volmer quenching constants were obtained from the slopes of the line fitted to the equation as described under Materials and Methods. Data are represented as mean ± SD from 3 or 4 independent experiments.
