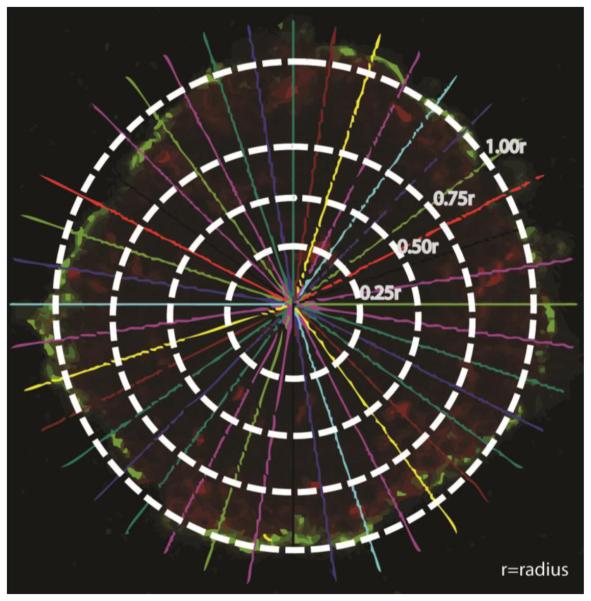
Figure 3.
Image of an optical section along the z-axis of a breast cancer spheroid stained with Cell Tracker Red Dye and incubated with fluorescent nanoparticles (green color). The image shows four concentric rings representing 0.25r, 0.5r, 0.75r, and 1.00r where r is the spheroid's radius. The 40 lines originating from the spheroid's center pointing towards the spheroid's surface were used to divide the image into equal sections to measure the fluorescence intensity (red and green) along the spheroid's radius (r) to quantitatively measure the depth of penetration of fluorescent nanoparticles (green) into the spheroid's core.

