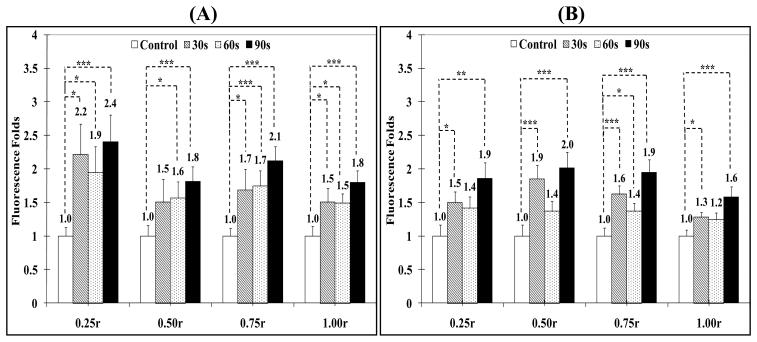
Figure 8.
Change in fluorescence intensity in MCF-7 spheroid's core (0.25r), intermediate layers (0.50r and 0.75r), and surface (1.00r) upon incubation with 50 μl of Optison microspheres and (A) 20 nm CdSe particles with non-functionalized surface (neutral) or (B) 20 nm cationic particles with primary amine surface groups upon exposure to pulsed US at 10% DC. All results are the average of 15 samples ± the standard error of the mean. The * indicates p < 0.05, ** p < 0.01, and *** p < 0.005 when comparing the test and control groups.

