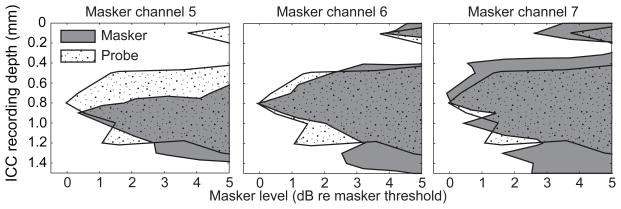
Figure 10.
Spatial tuning curves for masker and probe stimuli. Spatial tuning curve conventions are as in Figs. 1 and 4, except that the abscissa is in units relative to the masker alone threshold. In each panel the response to the non-masked single pulse, fixed-level probe is shown by the stippled curve. The shaded areas are the tonic responses to the last 50 ms of the 200-ms maskers, presented through cochlear implant channels 5 (left), 6 (middle) and 7 (right). The masking stimuli were δ = 0.5, and the probe stimulus was δ = 1.0. Data are from GP5.

